Spring Boot code quality metrics using SonarQube in docker
November 23, 2016
As part of an effort to gain some visibility into our overall code quality we have been working on integrating some tools and services that analyse code and provides code quality and test coverage metrics.
Some of our team members have had good experience using SonarQube for this type of code related insights. So we attempted to find a hosted version of SonarQube that we could integrate our CI/CD pipeline with, unfortunately we could not find anything.
What to do now?
Since we could not find any hosted version of SonarQube and we really don´t want to be setting up our own on-premises or cloud self hosted VM that we need to maintain. We ended up investing a little bit of time in making SonarQube available as a service locally for our developers if they want to use it.
While at the same time we are looking into different hosted code quality and coverage services in the cloud. (I will be doing a separate post on that once we get some more time to investigate).
Running SonarQube locally using Docker
For this post i am going to assume that whoever is reading this knows the basics of what Docker is and how it works. (If you don’t go checkout the What is Docker? section of the Docker website).
The first thing we need to do is go find a Docker image containing SonarQube. We can either do this through DockerHub or the new Docker Store - Beta.
Searching for SonarQube in Docker Store shows us one official option that is listed as FREE. So this looks promising.
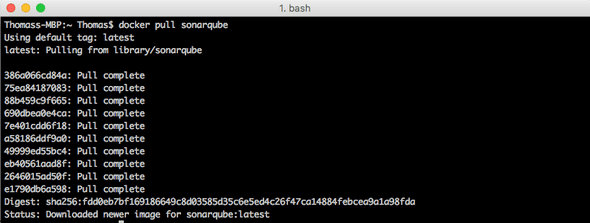
Pull down the sonarqube image
docker pull sonarqubeNow to start the SonarQube image run this command as stated in the SonarQube image documentation.
docker run -d --name sonarqube -p 9000:9000 -p 9092:9092 sonarqubeThis will start a container based on the sonarqube image and give it the name sonarqube. Adding the -d means the container will run in detached mode (background). The -p 9000:9000 and 9092:9092 means that we expose port 9000 and 9092 to the host using the same port numbers.
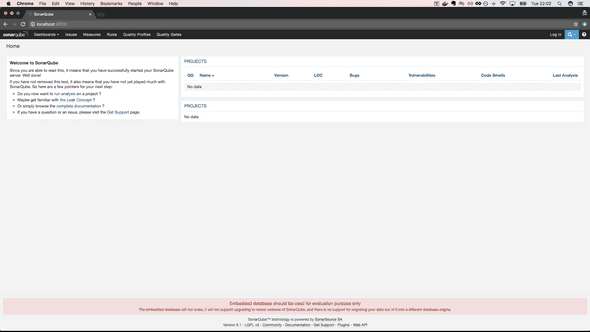
Now you can navigate to localhost:9000 and you will see your local SonarQube dashboard.
So now we are halfway there. Time to get some data into SonarQube for analysis!
Getting data into SonarQube from our Spring Boot application
I prefer using gradle as the build system for my Spring Boot applications and a quick search in google for “sonarqube gradle plugin” returned SonarQube gradle plugin.
Add the dependency and apply the sonarqube plugin in your build.gradle file.
buildscript {
	ext {
		springBootVersion = '1.4.2.RELEASE'
	}
	repositories {
		mavenCentral()
	}
	dependencies {
		classpath("org.springframework.boot:spring-boot-gradle-plugin:${springBootVersion}")
		classpath("org.sonarsource.scanner.gradle:sonarqube-gradle-plugin:2.2.1")
	}
}

apply plugin: 'org.sonarqube'
Your project is now ready to be analysed by SonarQube. Start the plugin by running the command below.
./gradlew sonarqubeOnce its done running, navigate back to your local SonarQube instance at localhost:9000 and you should now see your application listed under projects.
This will show you a brief overview with some information regarding things that SonarQube classifies as bugs, vulnerabilities and code smells.
Click on your application in the projects list to drill down into your application using SonarQube and see whats available.
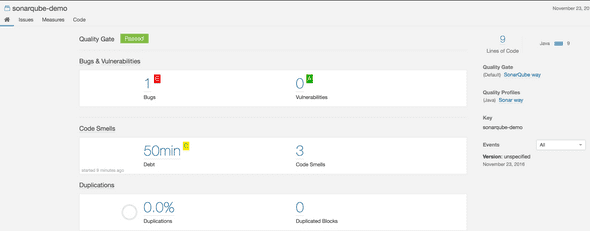
Overview
Overview of your project metrics related to code quality.
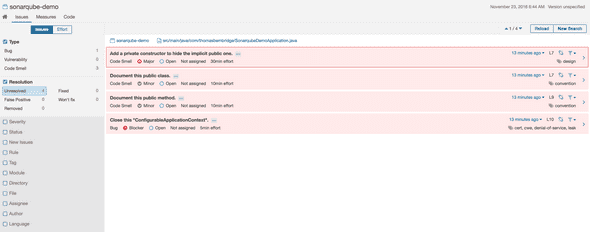
Issues
Shows a list of issues that SonarQube identified in your application. This is probably the place where you will spend most of your time. Sorting through the different issues reported by SonarQube to see what you can and want to fix.
SonarQube reports on a lot of things default out of the box with this setup. So use the issues page with caution is my tip. But you can without a doubt find some worthy insights going through this on larger projects.
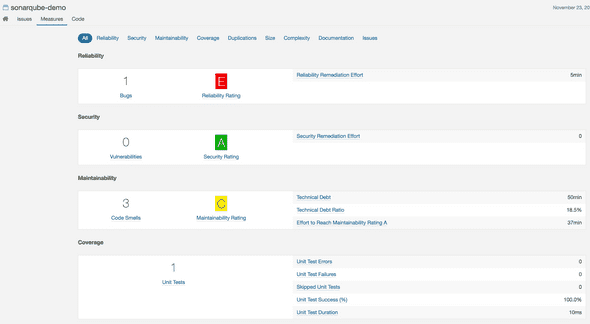
Measures
The measures pages gives you a whole bunch of metrics broken down into different categories. Often containing estimates on how much time it would take to improve the specific category.
Code
The code pages shows your application broken down into its packages. For each package it shows lines of code, bugs, vulnerabilities, code smells, coverage and duplications.
It will also allow you to drill down into packages and see the same type of metrics display per class inside of each package.
Simplify the process
Now we have something that works, but we would like to simplify and standardize the process so that its even easier for our developers to use SonarQube.
We would also like to integrate this offering into our microservices template so that once we generate new projects this local SonarQube offering is available out of the box.
To do do this we create a small script that contains all the necessary steps
#!/usr/bin/env bash
docker rm -f sonarqube
if [ $(uname) == "Darwin" ]; then
    docker run -d --name sonarqube -p 9000:9000 -p 9092:9092 sonarqube
    sleep 5
else
    sudo docker run -d --name sonarqube -p 9000:9000 -p 9092:9092 sonarqube
    sleep 5
fi

./gradlew sonarqube

if [ $(uname) == "Darwin" ]; then
    open "http://localhost:9000"
else
    xdg-open http://localhost:9000
fi
We save this script as start-sonar.sh and add it as a file on the top level of our solution. So now once we create a new project based on our template, a developer only has to run
./start-sonar.sh This will first remove any current SonarQube container running, then run / download the docker image and start up SonarQube. Run the gradle plugin that pushes data to SonarQube and then open a website at localhost:9000 that shows the SonarQube dashboard.
Summary
The process of getting SonarQube running locally and connected to our application was fairly straight forward. There are a bunch of metrics available in the dashboard out of the box. So this allows us to run short local feedback loops on our code without having to push to the cloud and integrate with other services.
The limitation with this dockerized SonarQube is that any customizations and optimizations you do is only valid for as long as your container is running. But to get some quick feedback on your code i think this approach adds value!
We will continue to look into some other hosted alternatives regarding code quality and coverage. So stay tuned for another blog post!
Written by Thomas Bembridge Software Developer working at SpareBank 1 in Norway. Opinions and ideas shared through this blog are my own. Follow me on Twitter!

