Hosted services for code coverage and quality metrics - part 1
November 30, 2016
As mentioned in my previous blog post Spring Boot code quality metrics using SonarQube in docker we have been focusing on getting some tools and services into our workflow that will give us better insight into our test coverage and overall code quality.
Our requirements have been pretty simple:
- Java support, preferably also javascript
- Code coverage calculated out as a % number that we can access through an API and display it on one of our status monitors.
- Test coverage is all fine and dandy, but we would also like something that will give us information regarding our codes overall quality, potential vulnerabilities, code improvements etc.
- Hosted service
Candidates
- Codecov.io
- Codacy.com
- Codebeat.co
- Coveralls.io
Codecov
We initially started out exploring Codecov as that was the first option that popped up on google. It was fairly easy to get setup with and it had an API that we could pull coverage statics from and display on our monitors.
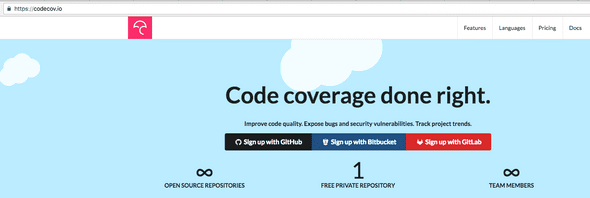
Head over to Codecov.io to get started.
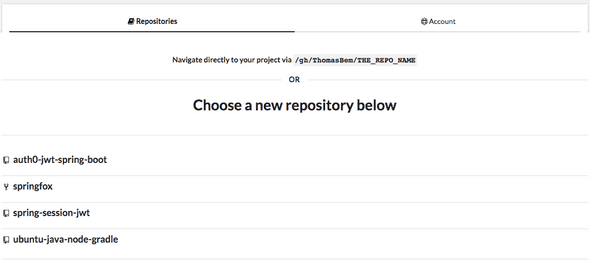
Once you signup and authorise you will be presented with the option to add a repository.
Select the repository you want to get started with.
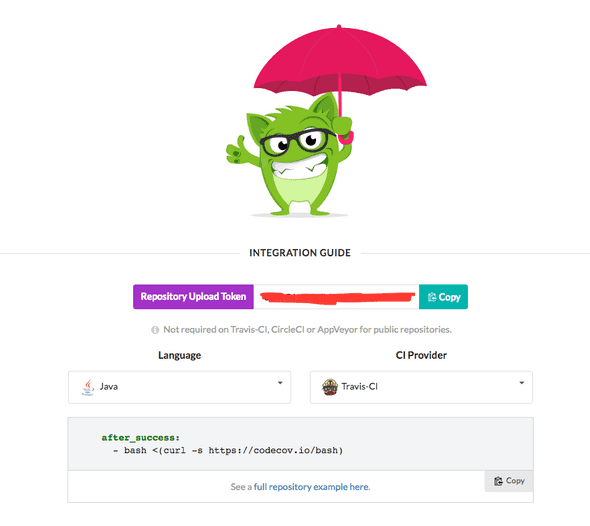
You will then be presented with a simple interactive integration guide.
Here you can select the programming language and continuous integration provider you are using and it will show you how to setup the integration. There will also be a link to a more detailed example that matches your selection.
Since the project i am using for this example (github.com/ThomasBem/auth0-jwt-spring-boot) is Java based and uses Travis CI i will follow the instructions listed for that selection, java example.
To get Codecov integration working for my project I need to add the JaCoCo plugin to the pom.xml and add a after_success step in travis.yml.
<plugin>
    <groupId>org.jacoco</groupId>
    <artifactId>jacoco-maven-plugin</artifactId>
    <version>0.7.7.201606060606</version>
    <executions>
        <execution>
            <goals>
                <goal>prepare-agent</goal>
            </goals>
        </execution>
        <execution>
            <id>report</id>
            <phase>test</phase>
            <goals>
                <goal>report</goal>
            </goals>
        </execution>
    </executions>
</plugin>
language: java
jdk:
- oraclejdk8
install: true
script:
./mvnw package
after_success:
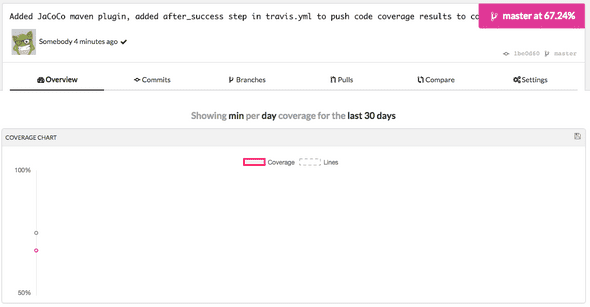
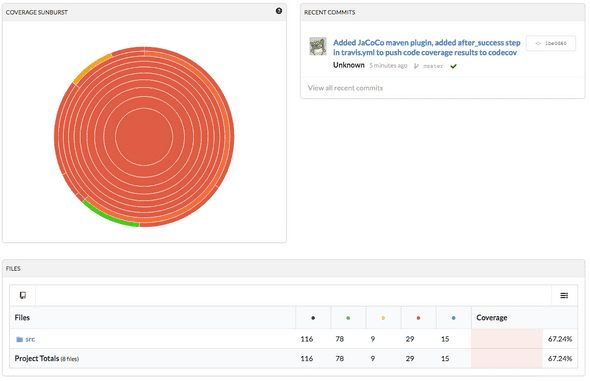
- bash <(curl -s https://codecov.io/bash)After adding this and doing a git push this is what shows up in Codecov.
So what Codecov gives you is general code coverage percentage, code coverage percentage as a trend over time and some fancy sunburst graph that honestly did not mean much to me. It looks all red and terrible in my example project, even though i think the coverage is pretty decent here. Classes with logic are tested, pure data classes are not.
If anyone knows how to properly interpret this graph please enlighten me! :)
So while Codecov is very easy to get started with, it turned out to be a little simple for our needs. We are lacking the code quality part of our requirements list.
Codacy
The next option on our list is Codacy. They provide metrics regarding code style, security, duplication, complexity and coverage.
Visit Codacy.com to get started.
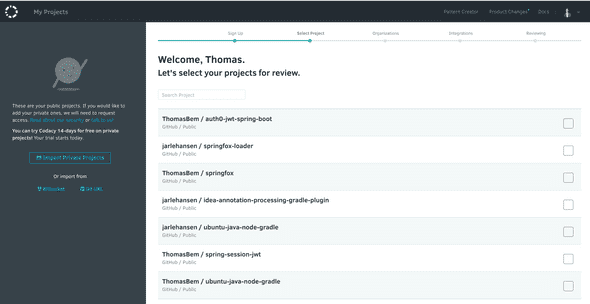
Similar to Codecov they also support multiple ways of signing up and connecting to your repositories. Once signup is complete you will be presented with a list of your available open source repositories.
Select the ones you want to start monitoring and continue through the setup process. The next step will allow you to setup a organisation with team members who will have access to you’re selected projects.
Since i am just setting up this as an example i will just skip this step and continue to integrations.
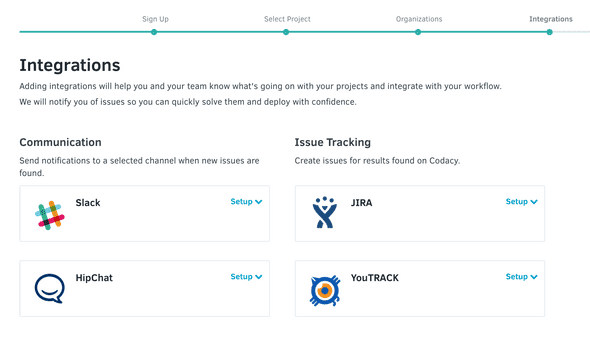
So Codacy allows you to integrate some external services into your workflow. Slack and HipChat for notifications regarding issues found when Codacy analyses your project. Then also Jira and YouTRACK for task management around solving the issues found. Again since this is just an example i will skip this step.
The main setup is now finished and Codacy will go ahead and checkout the code and start analysing it.
This step can take some time depending on the size of your project. But for my small example it did not take long.
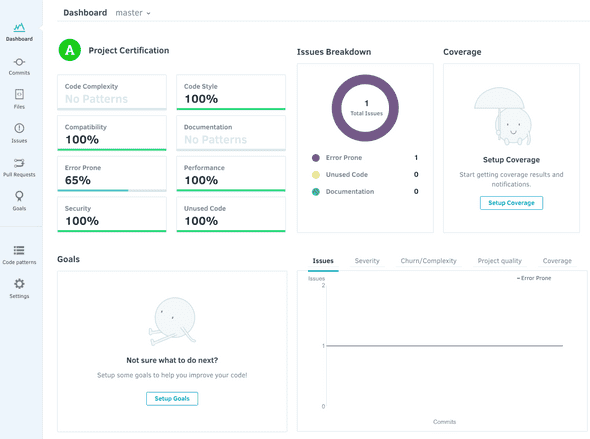
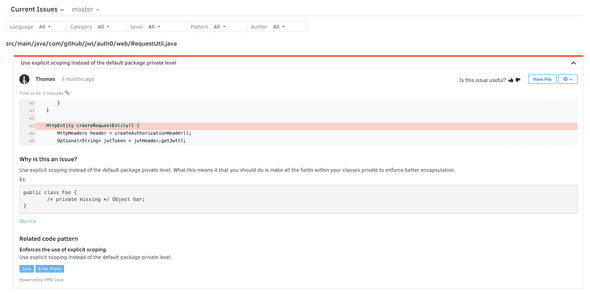
So after a quick analysis run there is now one issue listed for our example project. Click the “Start fixing” link and you will get taken to your projects dashboard.
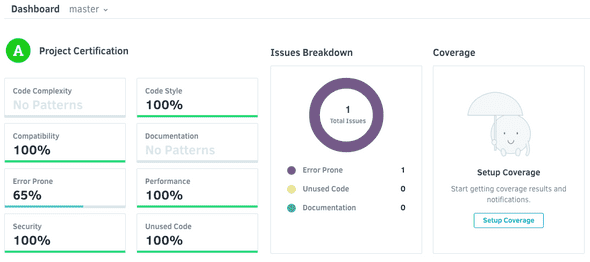
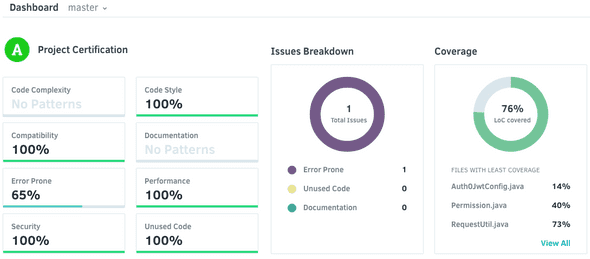
Here you will be presented with:
- Metrics regarding your code.
- Breakdown of the issues found during analysis.
- Code coverage report (Requires some setup that we will get to soon).
- Goals for the project (Requires setup).
- Graph that shows the different metrics measured over time.
In the left hand side of the dashboard is a navigation menu that lets you access some other pages. Out of these pages the interesting ones seem to be:
- Issues
- Code patterns
- Goals
So lets take a quick look at these.
Issues
The issues page will list all of the issues found in your code. It uses the code patterns configured to determine what classifies as issues, so by default you might get things you consider to be false positives here. Tweak the code patterns to fit your code style and this should clear up and become helpful suggestions regarding code quality.
Code patterns
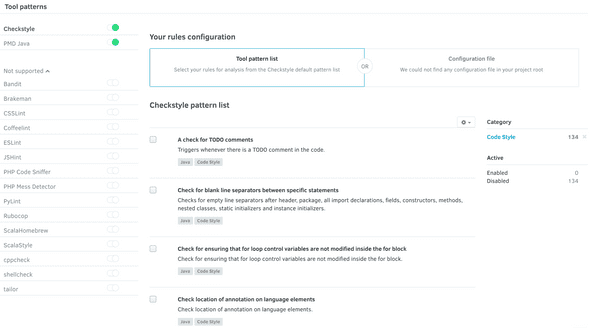
This page will allow you to tweak code patterns for your specific application type. By default it will apply known code patterns to your application based on the programming languages it finds.
It is also possible specify configuration by uploading configuration files in the code patterns page or adding them to the root folder of your repository.
See this page for more information, codacy configuration files
Goals
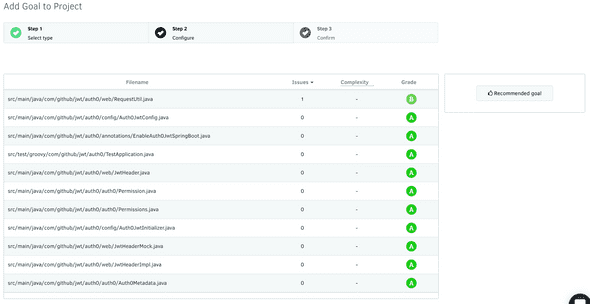
The goals page will allow you to define goals for increasing code quality either based on improving a specific file or a category.
Selecting improve file and you get presented with a menu to choose what file to improve or use the recommended goal button to have a goal created for you.
Selecting improve category gives you a similar experience just for category.
The result of either operation will be a specific goal to work on to increase code quality.
Code coverage
To enable code coverage metrics we need to setup something similar to what we did with Codecov.
Code coverage reports must be generated during the building of our application in the CI server and get pushed to Codacy.
From your applications main dashboard click the setup coverage button.
Grab your applications token and select the language you are using. This will open a Github page containing instructions for your specific language. In our case, Codacy Coverage Reporter - Java.
There are many options listed here but since we are still using Travis CI we will go for that option.
First set the application token you copied earlier as an environment variable in Travis. Then update travis.yml to contain the steps listed below.
before_install:
  - curl -sL https://github.com/jpm4j/jpm4j.installers/raw/master/dist/biz.aQute.jpm.run.jar >jpm4j.jar
  - java -jar jpm4j.jar -u init
  - ~/jpm/bin/jpm install com.codacy:codacy-coverage-reporter:assembly

after_success:
  - ~/jpm/bin/codacy-coverage-reporter -l Java -r target/site/jacoco/jacoco.xml
Make sure that you are targeting the right folder in the after_success step when locating the test report file. In my case that required a minor change from what was listed on the Github page.
I modified the after_success step from the example code:
after_success:
  - ~/jpm/bin/codacy-coverage-reporter -l Java -r build/reports/jacoco/test/jacocoTestReport.xml
To something that fit my project:
after_success:
  - bash <(curl -s https://codecov.io/bash)
  - ~/jpm/bin/codacy-coverage-reporter -l Java -r target/site/jacoco/jacoco.xml
Now after pushing the changes and having my project build in Travis CI. The Codacy dashboard contains code coverage metrics!
Summary - Part 1
This turned into a long post as i was writing it and since there are still two alternatives left i decided to split it into two post.
At the time of me wrapping up this part 1 we are currently using Codacy. Its nice having both coverage and quality metrics in one tool. The one requirement that we have been struggling with though is API access for getting metrics onto our status displays.
I will admit that we have not invested a ton of time in this, but compared to how easy it was to get working with Codecov it is a bit disappointing.
Stay tuned for part 2!
Written by Thomas Bembridge Software Developer working at SpareBank 1 in Norway. Opinions and ideas shared through this blog are my own. Follow me on Twitter!
